How to find out which process is causing high disk usage in Linux
October 18, 2021
Monitoring input and output operations
Excessive load on the disk can be caused by such a reason as a virus infection or incorrect program settings. In any case, you need to start by identifying the process (program) that most reads and writes to disk.
iotop – analog of top for tracking disk load in real time
The top program allows you to see which processes are consuming the most CPU time and RAM, but does not say anything about disk usage, reads and writes to disk.
See also: How to use the top command to monitor Linux processes
The iotop program shows the speed of reading and writing to the disk, as well as the percentage of paging file used by each process.
To install iotop on Debian, Linux Mint, Kali Linux, Ubuntu and their derivatives, run the command:
sudo apt install iotop
To install iotop on Arch Linux, BlackArch, Manjaro and their derivatives, run the command:
sudo pacman -S iotop
The program requires elevated privileges to run:
sudo iotop
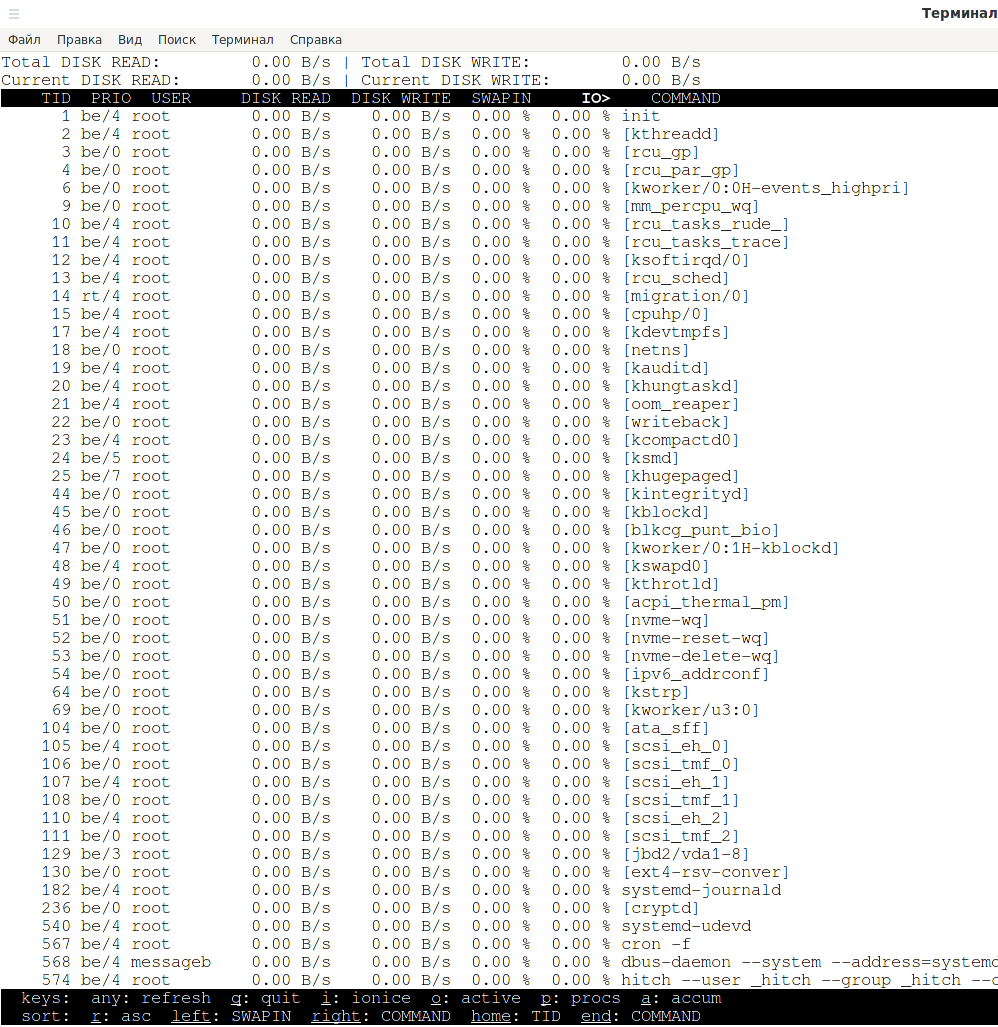
The program output contains the following columns:
- TID – process identifier
- PRIO – process priority
- USER – the user who owns the process
- DISK READ – disk read speed
- DISK WRITE – disk write speed
- SWAPIN – the percentage of swap file used
- IO> – percentage of all I/O operations
- COMMAND – the command that started the process
Using the cursor right (→) and left (←) keys, you can switch between columns, simultaneously choosing which of them will be sorted by.

With the buttons “Home” and “End” you can switch between the outermost columns.
Pressing any key will refresh the window.
Press “q” to exit.
By pressing the “o” key, you will switch to showing only active processes, that is, only processes that write and read data from persistent storage. You can get the same result by running the program with the -o option:
sudo iotop -o
Pressing the “o” key again will return the display of all processes.
Descending sorting is used by default, using the “r” button you can switch between descending and ascending sorting.
The “p” button toggles between displaying processes and streams.
By default, read and write speeds are shown, using the “a” button you can switch to displaying the total amount of written and read data.
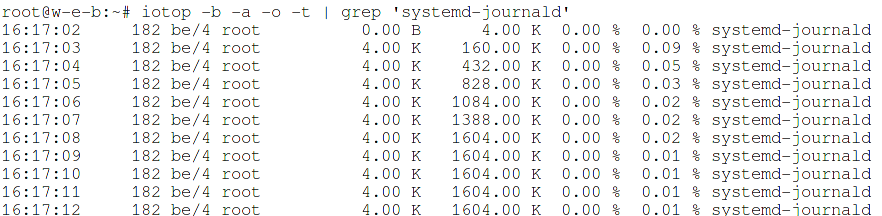
iotop has several options that allow you to control the behavior of the program, for example, the following command will work in batch mode (-b), showing the total amount of written and read data (-a) only for active processes (-o), to the output data will be appended timestamp (-t), only systemd-journald information will be filtered from all processes (grep 'systemd-journald'):
iotop -b -a -o -t | grep 'systemd-journald'
pidstat – Display statistics for Linux tasks
The sysstat package contains two utilities at once with which you can collect statistics on disk usage by processes:
- pidstat
- iostat
To install pidstat on Debian, Linux Mint, Kali Linux, Ubuntu and their derivatives, run the command:
sudo apt install sysstat
To install pidstat on Arch Linux, BlackArch, Manjaro and their derivatives, run the command:
sudo pacman -S sysstat
The next command will display the accumulated statistics for every 20 seconds, only active processes will be shown (that have made read and write operations to the disk during the specified interval), and the full command that started the process will also be shown. For more complete statistics, run the program with elevated privileges:
sudo pidstat -dl 20
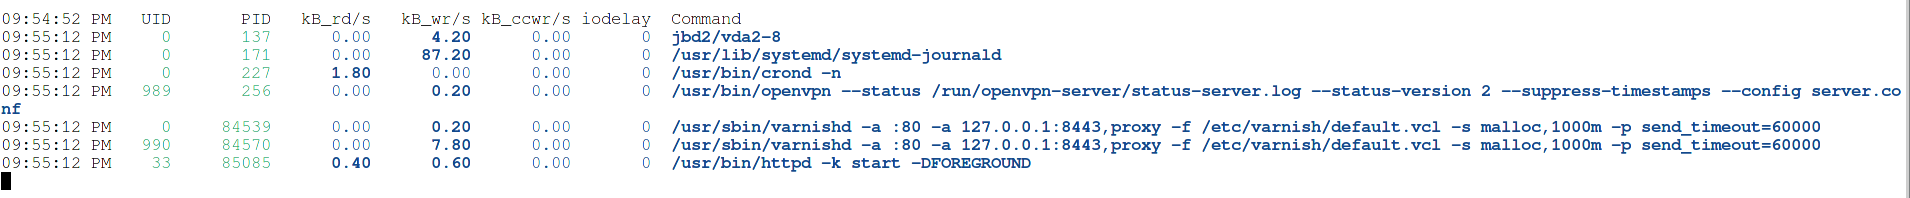
Each row will have the following columns:
- Time stamp
- UID: The real user identification number of the task being monitored.
- USER: The name of the real user owning the task being monitored.
- PID: The identification number of the task being monitored.
- kB_rd/s: Number of kilobytes the task has caused to be read from disk per second.
- kB_wr/s: Number of kilobytes the task has caused, or shall cause to be written to disk per second.
- kB_ccwr/s: Number of kilobytes whose writing to disk has been cancelled by the task. This may occur when the task truncates some dirty pagecache. In this case, some IO which another task has been accounted for will not be happening.
- iodelay: Block I/O delay of the task being monitored, measured in clock ticks. This metric includes the delays spent waiting for sync block I/O completion and for swapin block I/O completion.
- Command: The command name of the task.
iostat – statistics of using devices and disk partitions
The iostat utility is also included in the sysstat package. As you might guess from the name of the program, it generates reports on I/O statistics for devices and partitions. Its peculiarity is that it shows generalized statistics for the entire system, as well as for individual disks, without breaking it down into processes. The iostat program can come in handy when you need to answer the question: “Which of the persistent media is most loaded?”
Running the program without options
iostat
will display two blocks of information:
- CPU utilization report
- device usage report
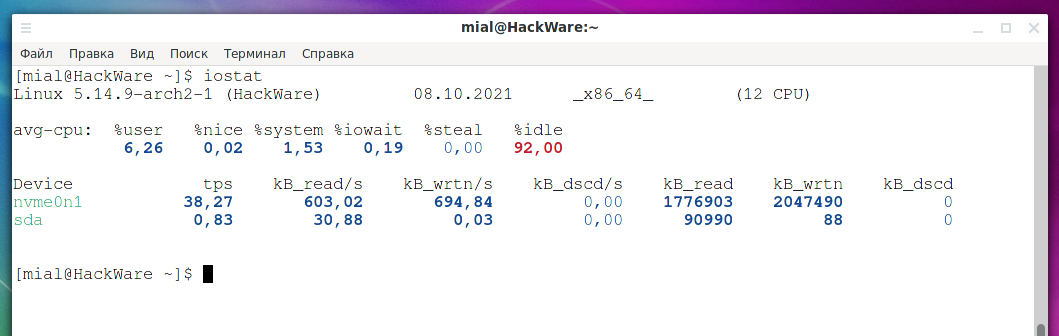
The section with device usage statistics contains the following columns:
- Device: This column gives the device (or partition) name as listed in the /dev directory.
- tps: Indicate the number of transfers per second that were issued to the device. A transfer is an I/O request to the device. Multiple logical requests can be combined into a single I/O request to the device. A transfer is of indeterminate size.
- kB_read/s: Indicate the amount of data read from the device expressed in a number of kilobytes per second. Blocks are equivalent to sectors and therefore have a size of 512 bytes.
- kB_wrtn/s: Indicate the amount of data written to the device expressed in a number of kilobytes per second.
- kB_dscd/s: Indicate the amount of data discarded for the device expressed in a number of kilobytes per second.
- kB_read: The total number of kilobytes read.
- kB_wrtn: The total number of kilobytes written.
- kB_dscd: The total number of kilobytes discarded.
The report is output for the entire system from the moment it was booted.
Since data is output in kilobytes by default, and modern volumes of information written to disk are usually multiples of a gigabyte, the numbers are difficult to read. To display numbers in human-readable units, use the -h option:
iostat -h

The -h option is the equivalent of specifying two options --human and --pretty at once, so if you are not completely satisfied with the appearance of the outputted report, then try using these options separately.
To display as much information as possible, use the -x option:
iostat -x
If you only want information about devices, then use the -d option:
iostat -d
You can run the command by specifying the interval time (in seconds) and the counter (number of reports) – in this case, the program will display information at the specified interval:
iostat INTERVAL
iostat INTERVAL COUNTER
The first report will contain information from the moment the system was booted, and subsequent reports will contain information for the period since the previous report.
To find problems, you can use the following command, which will continuously print information:
iostat -d 1
iostat -dx 1
With iostat, you can monitor the read and write speed of the entire device, as well as identify discarded blocks.
Related articles:
- What files can be deleted when there is not enough disk space in Linux (82.6%)
- How to find out the number of starts and the total working time of a disk in Linux (63.1%)
- How to know when the ext4/ext3/ext2 filesystem was created and when it was last mounted (63.1%)
- How to determine why Linux boots into Emergency mode (63.1%)
- How to repair an LVM disk using fsck (63.1%)
- How to install and configure best video player on Linux (SMPlayer) (RANDOM - 50%)