How to use ps command to monitor Linux processes
October 30, 2021
The ‘ps’ (processes status) command is a built-in Unix/Linux utility for viewing information regarding the selection of running processes on the system: it reads this information from virtual files in the /proc file system. It is one of the essential system administration utilities, especially in the context of process monitoring, to help you understand what is happening on a Linux system.
ps has many options for manipulating the output, but you will find a small number of them practically useful for daily use.
The ps utility displays a snapshot of the processes on your Linux machine. You will be able to find processes by name, user or even terminal with as much detail as you need. This article has prepared many examples of using ps.
Linux process control
The heart of all Linux and Unix-like operating systems is the kernel. Among its many responsibilities is the allocation of system resources such as RAM and CPU time. They must be executed in real time so that all running processes get their fair share according to the priority of each task.
Sometimes tasks can be locked, or get stuck, or stop responding for other reasons. Or they can continue to run, but gobble up too much processor time or RAM, or behave in some similar antisocial manner. Sometimes tasks need to be killed to keep the system running smoothly. Of course, the first step is to identify the problematic process.
But perhaps you have no problem with tasks or performance at all. Perhaps you're just curious about what processes are running on your computer and would like to look under the hood of the Linux operating system. The ps command meets both of these requirements. It gives you a snapshot of what is happening inside your computer “right now”.
ps is flexible enough to provide you with exactly the information you need, in exactly the format you like. In fact, ps has a lot of options. The options described here will suit most common needs. If you want to take a deeper look at the ps command, familiarizing yourself with the ps command in this article and examples of using ps will make the man page easier for you.
Program for showing processes in Linux
The easiest way to use ps is to run it without parameters:
ps
ps will show the list of processes in the given terminal.
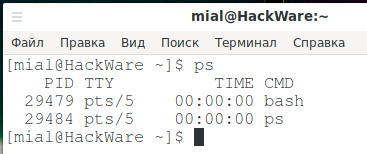
There are four columns in the output:
- PID: process identification number.
- TTY: The name of the console the user is signed in to.
- TIME: The amount of CPU time that the process consumed.
- CMD: the name of the command that started the process
How to see all processes in Linux
Adding the -e (select all processes) option will make ps list the processes that were started by all users, not just the user running the ps command. Since this will be a long list, you can add the less command.
ps -e | less
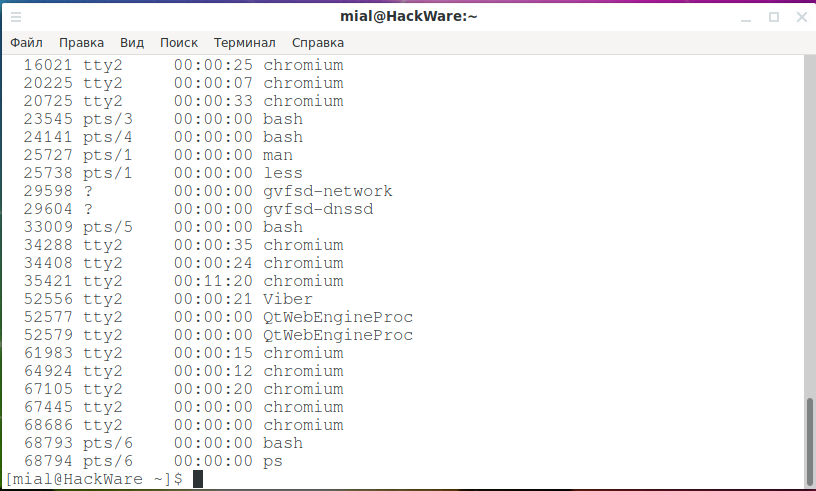
Scrollable list of processes in less command:
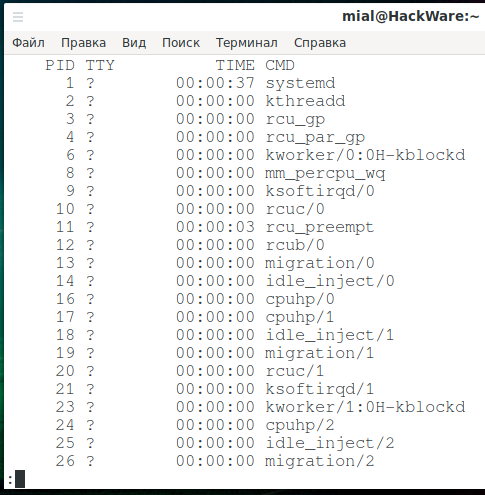
There are many more process records now, but we see the same four columns as before. A question mark (?) In the TTY column means that the process was not started from a terminal window.
Displaying the hierarchy of processes (process tree in Linux)
If you see what processes other processes have started, sometimes it can help you figure out a problem or identify a specific process. For this we use the -H option.
ps -eH | less
Indentation indicates which processes are the parents of which other processes.

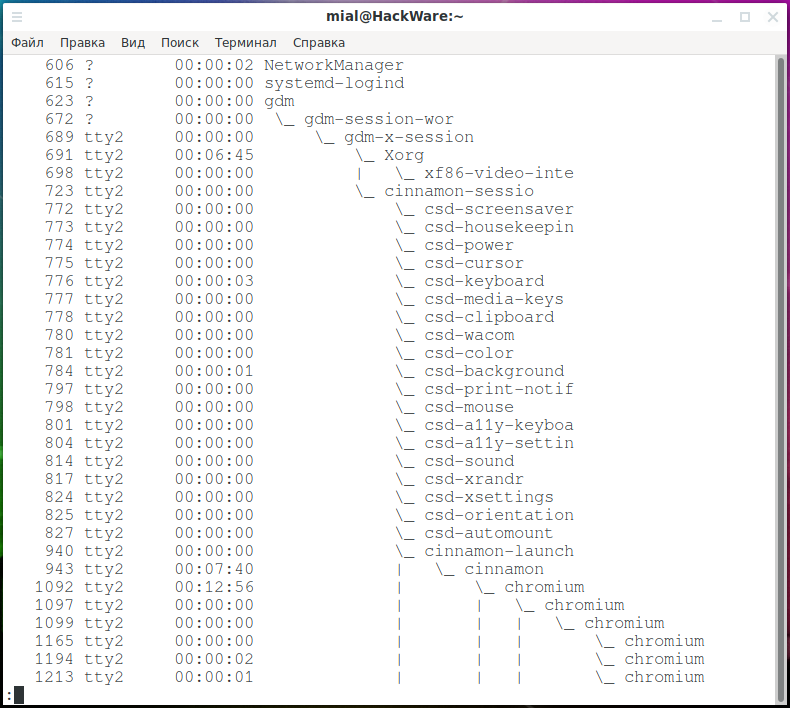
To add some clarity, we can ask ps to add some ASCII lines and draw a tree-like hierarchy. This can be done with the --forest option.
ps -e --forest | less
This makes it easier to keep track of which processes are the parents of other processes.
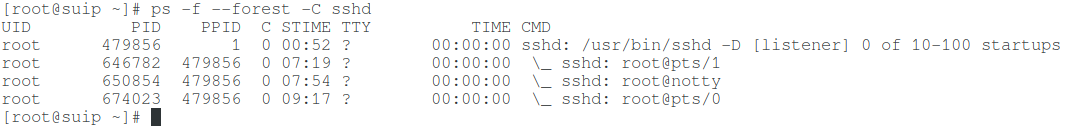
How to print a tree of a specific process
You can get the process tree of only the program you need as follows (replace “sshd” with the process you are interested in):
ps -f --forest -C sshd
Or like this:
ps -ef --forest | grep -v grep | grep sshd
The -C option will be discussed later in this article.
Filtering ps output by specific lines (by command name, for example)
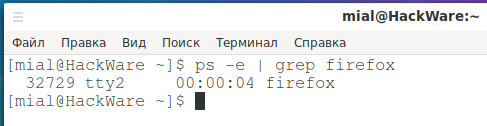
You can pipe the output from ps through grep and find the process entries you want along any lines. Here we are looking for entries matching the search term “firefox”:
ps -e | grep firefox
In this case, the output is a single record for the process of interest. Of course, if we were running multiple instances of Firefox, there would be more than one item in the list.
More columns in ps output
To add additional columns to the output, use the -f (full format) option.
ps -ef | less
An additional set of columns is included in the ps output.

The following new columns have been added:
- UID: User ID of the owner of this process.
- PPID: Parent Process ID.
- C: The number of children the process has.
- STIME: Start time. The time when the process was started.
Using the -F (extra full format) option, we can get even more columns:
ps -eF | less
If you have a small terminal window, the columns we get this time require scrolling to the side to show them all. Pressing the Right Arrow key (→) shifts the display to the left.
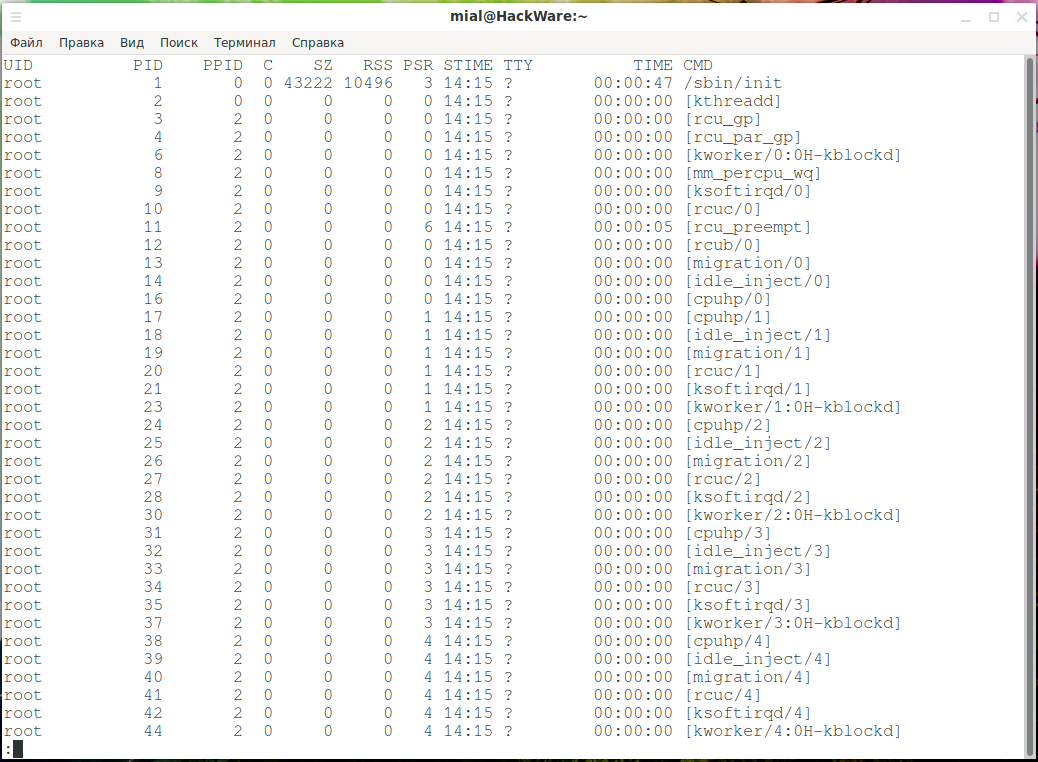
The following columns have now been added:
- SZ: The size of the RAM pages of the process image.
- RSS: Resident Set Size. It is not the swapped physical memory used by the process.
- PSR: The processor to which the process is assigned.
Do I need to put a hyphen in front of ps options
In some examples, you may see ps used with non-hyphen options or with long GNU-style options. For compatibility, ps supports all three formats. Non-hyphenated options are BSD style and the meaning of hyphenated and non-hyphenated options can be different!
An example of showing processes in BSD format:
ps au
# OR
ps axu
In this command, the meaning of the options is as follows:
- u – user oriented format
- a – removes the restriction “only own processes”
- x – removes the restriction “only processes with a terminal”
Simply put, if you use “a” and “x” together, then all processes will be shown.
Be careful not to forget to hyphenate if you are using UNIX options, since ps will try to interpret it differently if it is ambiguous. In this manual, except for the example shown above, UNIX options are used everywhere.
Search for processes by process ID
Once you have found the process ID for the process you are interested in, you can use it with the ps command to display detailed information about that process. To do this, use the -p parameter after which specify a number – the process ID:
ps -p 3403
More than one process ID can be specified, separated by commas or spaces.
Search for processes by command name
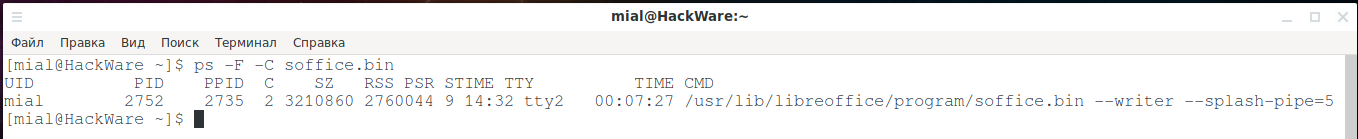
The -C COMMAND option allows you to search for a process using the command name. That is, the name of the command that started the process. This is slightly different from a command line, which can include path names and parameters or options.
ps -F -C soffice.bin
Only information about the process started by the specified command is displayed:
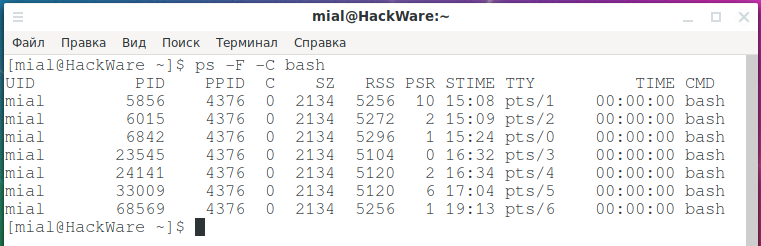
There can be several processes if many instances of this command are running:
ps -F -C bash
How to see the flows of a process
To list all threads in a process, use the -H flag. The -L option will display the LWP (light weight process) column as well as the NLWP (number of light weight process) column.
ps -fL -C httpd
How to see the processes of a specific user
To see the processes owned by a specific user, use the -u USERNAME LIST option:
ps -u mial
Processes belonging to the mial user account are displayed.
How to list all processes started by root user
This is a special case of showing the processes of a certain user.
The command below allows you to view each process running with root privileges (a valid and effective identifier) in user format.
ps -U root -u root
Viewing group processes
If you want to list all processes belonging to a specific group (real group ID (RGID) or name), enter:
ps -fG www-data
#OR
ps -fG 33
To list all processes belonging to the effective group (or session) name, enter.
ps -fg www-data
Listing processes by terminal
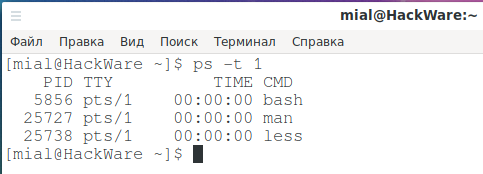
To see the processes associated with a TTY, use the -t SPECIFY TTY option. When used without a TTY number, the -t option reports the processes associated with the current terminal window.
ps -t 1
All listed processes are associated with pts/1.
Selecting columns to display
With the -o FORMAT option, you can choose which columns you want to include in the ps output. Columns must be specified by name. From the ps manual:
man ps
you'll find a long list of column names in the “STANDARD FORMAT SPECIFIERS” section.
In the following example, we display the CPU time consumed by the process (pcpu), the processor's memory consumption (pmem) and the command that ran it along with the options (args):
ps -e -o pcpu,pmem,args | less
Note that the -o option does not add columns to the default set, but only displays the indicated fields.

Sorting output by columns
You can sort the output using the --sort option. Let's sort the output by the CPU column:
ps -e -o pcpu,pmem,args --sort -pcpu | less
The hyphen “-” means sorting from highest to lowest.
To see the ten most resource-intensive processes, pipe the output through the head command:
ps -e -o pcpu,args,args --sort -pcpu | head -10
We get a sorted, truncated list.
If we add more columns to display, we can sort by more columns.
Without a hyphen or with a “+” sign, sorting is performed from smallest to largest.
Let's add the pmem column to the sort:
ps -e -o pcpu,pmem,args --sort -pcpu,pmem
Sorting is still performed by pcpu value, but if these values are the same for some records, then pmem sort is performed for these values.
Let's make the output a little more useful and add a process id (pid) column so we can see the process number of each process in our listing.
ps -e -o pid,pcpu,pmem,args --sort -pcpu,pmem | head -10
We can now identify the processes.
All possible ps fields
To see all possible ps fields, run this command:
ps L
You can use these fields with the -o option.
Custom ps output examples
The command below allows you to see the PID, PPID, username and command of the process.
ps -eo pid,ppid,user,cmd
Below is another example of a custom output format showing the file system group, nice value, start time, and elapsed time of the process.
ps -p 1154 -o pid,ppid,fgroup,ni,lstart,etime
How to find the name of a process by PID
To find the name of a process using its PID.
ps -p 1154 -o comm=
Show parent and child processes
To select a specific process by its name, use the -C flag, this will also display all of its child processes.
ps -C sshd
To find all PIDs of all process instances, which is useful when writing scripts that need to read the PIDs from the stdin.
ps -C httpd -o pid=
How to shutdown a process by process id
We've covered a number of ways to identify processes, including name, command, user, and terminal. We also looked at ways to identify processes by their dynamic attributes such as CPU and memory usage.
One way or another, we can define the processes that are running. Knowing their process ID, we can (if needed) stop any of these processes with the kill command. If we wanted to kill process 898, we would use this format:
sudo kill 898
See also: What are the differences and how to use the kill, pkill and killall commands
Please be aware that in some cases the process will not terminate and will not display any errors or warnings. In fact, this command is a “recommendation”, it “asks” the process to exit. See the article “Why doesn't the kill command kill the process?” for details.
How to disable a process knowing its name
The pkill command allows you to kill processes by name. Make sure you define the correct process! This command will end the top process.
sudo pkill top
How to stop multiple processes by name
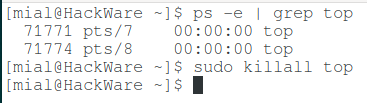
If you have multiple copies of a process running, or the process spawned multiple child processes (as Google Chrome can do), how can you shutdown them all? It's just as easy. We are using the killall command.
We have two instances of top running:
ps -e | grep top
We can terminate both of them with this command:
sudo killall top
Usually no response means no problem, that is, both of these processes have been stopped.
Before killing the process
Make sure it's the one you want and make sure it doesn't cause any problems. In particular, it is worth checking with the -H and --forest options to make sure there are no important child processes that you forgot about.
Troubleshooting Linux system performance
If your system is not working properly, for example, if it is unusually slow, you can troubleshoot some system problems as follows.
To find all the processes consuming the most memory and CPU in Linux:
ps -eo pid,ppid,cmd,%mem,%cpu --sort=-%mem | head
OR
ps -eo pid,ppid,cmd,%mem,%cpu --sort=-%cpu | head
Displaying security information
You can show the security context (specifically for SELinux) as follows:
ps -eM
OR
ps --context
You can also display security information in a user-defined format with this command:
ps -eo euser,ruser,suser,fuser,f,comm,label
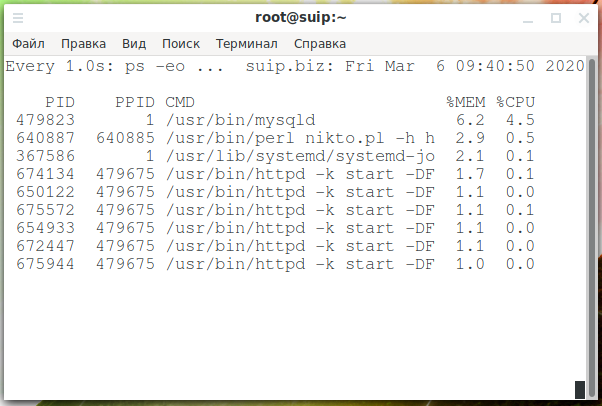
Monitor your processes in real time with the watch utility
Finally, because ps displays static information, you can use the watch utility to continuously update the screen information and monitor processes in real time with repeated output. In this example, the information will be updated every second. Specify your own ps command to suit your purpose.
watch -n 1 'ps -eo pid,ppid,cmd,%mem,%cpu --sort=-%mem | head'
See also:
- htop command guide: how to view processes in Linux interactively
- How to use the top command to monitor Linux processes
Related articles:
- How to use the top command to monitor Linux processes (100%)
- htop command guide: how to view processes in Linux interactively (100%)
- What are the differences and how to use the kill, pkill and killall commands (72.4%)
- Why doesn't the kill command kill the process? (70%)
- What happens if Linux runs out of RAM. Do I need a Swap file (59.4%)
- bash: finger: command not found in Arch Linux (RESOLVED) (RANDOM - 50%)