Tag: Linux processes

Do services need to be restarted when updating packages
Posted by Alex On January 24, 2022
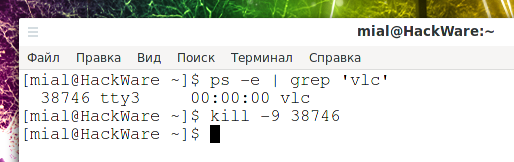
Why doesn’t the kill command kill the process?
Posted by Alex On October 30, 2021
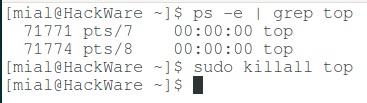
What are the differences and how to use the kill, pkill and killall commands
Posted by Alex On October 30, 2021

How to use ps command to monitor Linux processes
Posted by Alex On October 30, 2021

htop command guide: how to view processes in Linux interactively
Posted by Alex On October 17, 2021

How to use the top command to monitor Linux processes
Posted by Alex On October 17, 2021