
htop command guide: how to view processes in Linux interactively
October 17, 2021
Is htop better or top?
The htop command is similar to top in function: they both display real-time information about processes, display system resource consumption, and allow you to search, stop, and manage processes.
Both commands have their own advantages. For example, the htop program implements a very convenient process search and filtering. In the top command, this is not so convenient – you need to know the button to display the search function.
But in top, you can split the window area and display information about processes in accordance with different settings. In general, top is much more flexible in customizing the display of processes.
In general, to decide which command is best for you, try both of them. This article will go into detail about htop, to get familiar with top refer to the article “How to use the top command to monitor Linux processes”.
How to install htop
Install a package named htop using your distribution's package manager.
On Debian, Linux Mint, Ubuntu, Kali Linux and their derivatives, run:
sudo apt install htop
On Arch Linux, Manjaro, BlackArch and derivatives run:
sudo pacman -Syu htop
How to view all processes in Linux
The htop command can be run by a regular user:
htop
So to run it with superuser privileges, use sudo for this:
sudo htop
Superuser rights are needed only for some actions: to change the priority (nice) of processes, to close the processes of other users.
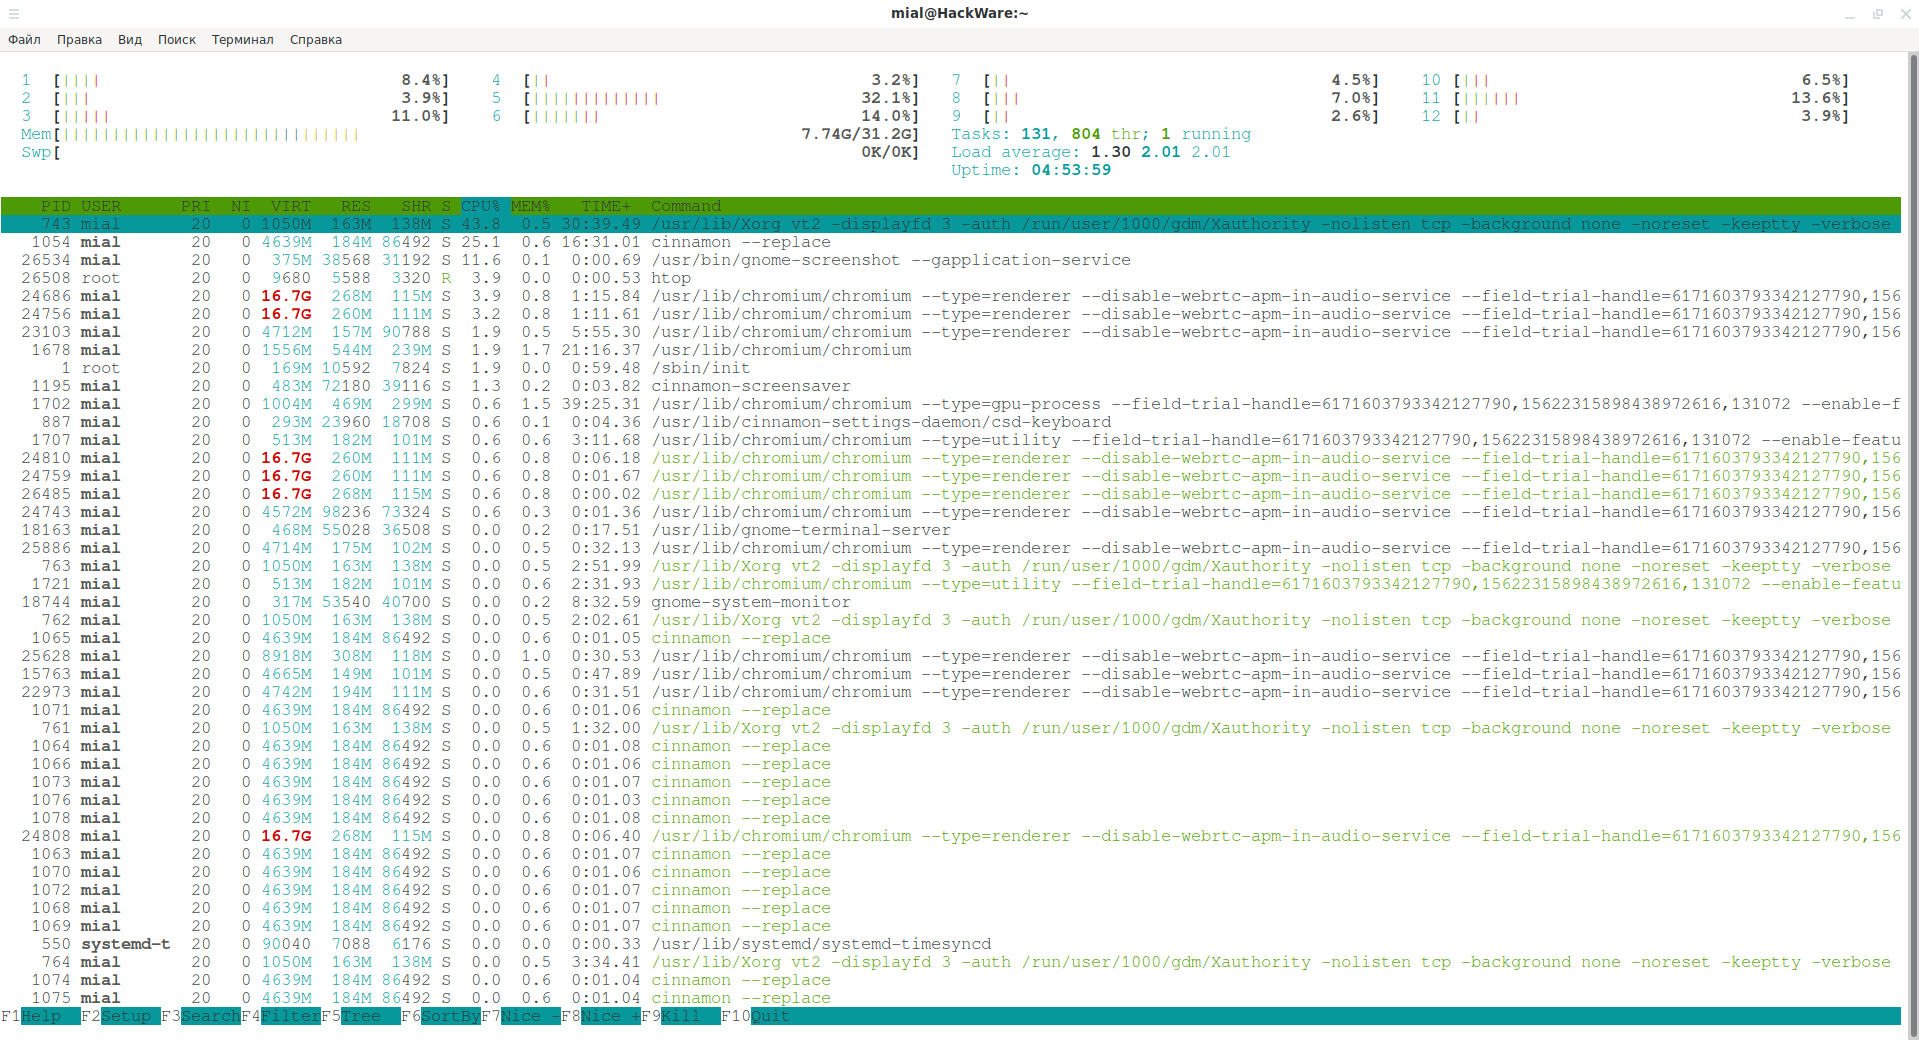
As with the top program, the window is divided into two main sections:
- generalized information about the system
- detailed information on processes
System information area

At the very top, the load on each core of the central processor is shown (numbers from 1 to 12).
Mem – the total amount of RAM and the memory used.
Task – generalized statistics on processes
Swp – swap file consumption level (if any)
Load average – average CPU load
Uptime – operating system uptime since the last boot
Now let's move on to the area with information about running processes.
Htop columns value

The htop program displays the following columns:
PID
Process ID.
USER
The username of the owner of the process, or ID if the name cannot be determined.
PRI
Priority is the internal kernel priority for the process, usually just nice plus twenty. Differs for processes with real-time execution priority.
NI
NICE process value from 19 (low priority) to -20 (high priority). A higher value means that the process is “nice” to others and allows them to have a higher execution priority.
VIRT
Process virtual memory size (M_SIZE).
RES
The size of the resident set (text + data + stack) of the process (i.e. the size of the physical memory used by the process, M_RESIDENT).
SHR
The size of the shared pages of the process (M_SHARE).
S
STATE, the state of the process, can be:
S for sleeping (idle)
R for running
D for disk sleep (uninterruptible)
Z for zombie (waiting for parent to read its exit status)
T for traced or suspended (e.g by SIGTSTP)
W for paging
CPU%
The percentage of CPU the process is currently using.
MEM%
The percentage of memory the process is currently using (depending on the size of the process resident memory, see M_RESIDENT above).
TIME+
The time measured in hours indicates how much the process has spent in user and system time.
Command
The complete command line of the process (that is, the program name and arguments).
How to speed up or slow down the htop refresh rate
To set the update time for htop, use the -d option, after which specify the update time in tenths of seconds. For example, to make the program refresh the window every 1/10th of a second:
sudo htop -d 1
To make the program display new data every 5 seconds:
sudo htop -d 50
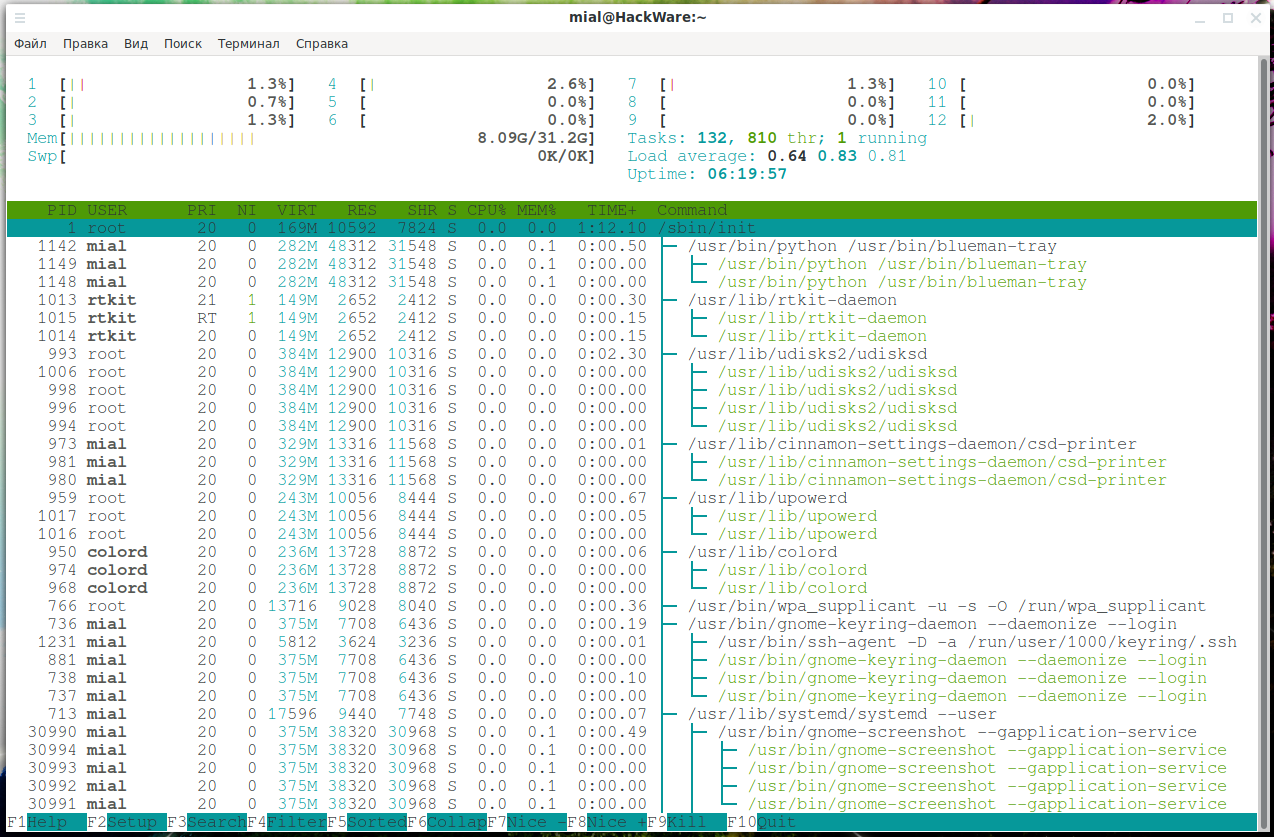
How to display processes in the form of a tree
To list processes as a tree, use the -t option:
sudo htop -t
Or, while the program is running, press the F5 key:
How to navigate the list of processes in htop
You can use the cursor keys (←, →, ↑, ↓) to scroll through the list of processes.
The “PgUp”, “PgDn” keys also work for scrolling the window.
The “Home” button will move to the top of the list.
The “End” button will scroll to the end of the list.
Ctrl-a or ^ – scroll to the beginning of the item (beginning of the line).
Ctrl-e or $ – scrolls to the end of a process entry item (that is, the end of a line).
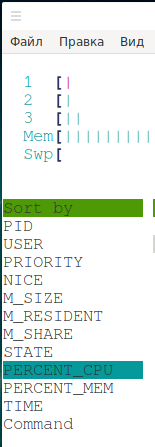
How to sort by memory consumption in htop. How to choose a field to sort
Press F6 to select the field you want to use for sorting.
To switch to the reverse sorting order, use the “I” (Shift+i) key. Pressing again will re-sort the list in reverse order.
How to collapse branches of a process tree in htop
In process tree mode, select the tree branch you want to collapse and press F6.
Searching and filtering processes in htop
Search differs from filtering in that the found processes are shown along with the rest, and you can switch between the found processes by pressing F3.
When filtering, only processes that match the pattern will be displayed on the screen.
Press F3 or “/” to go to process search. Press F3 to switch between found processes.
To filter processes, press F4 or “\” start typing the process name.
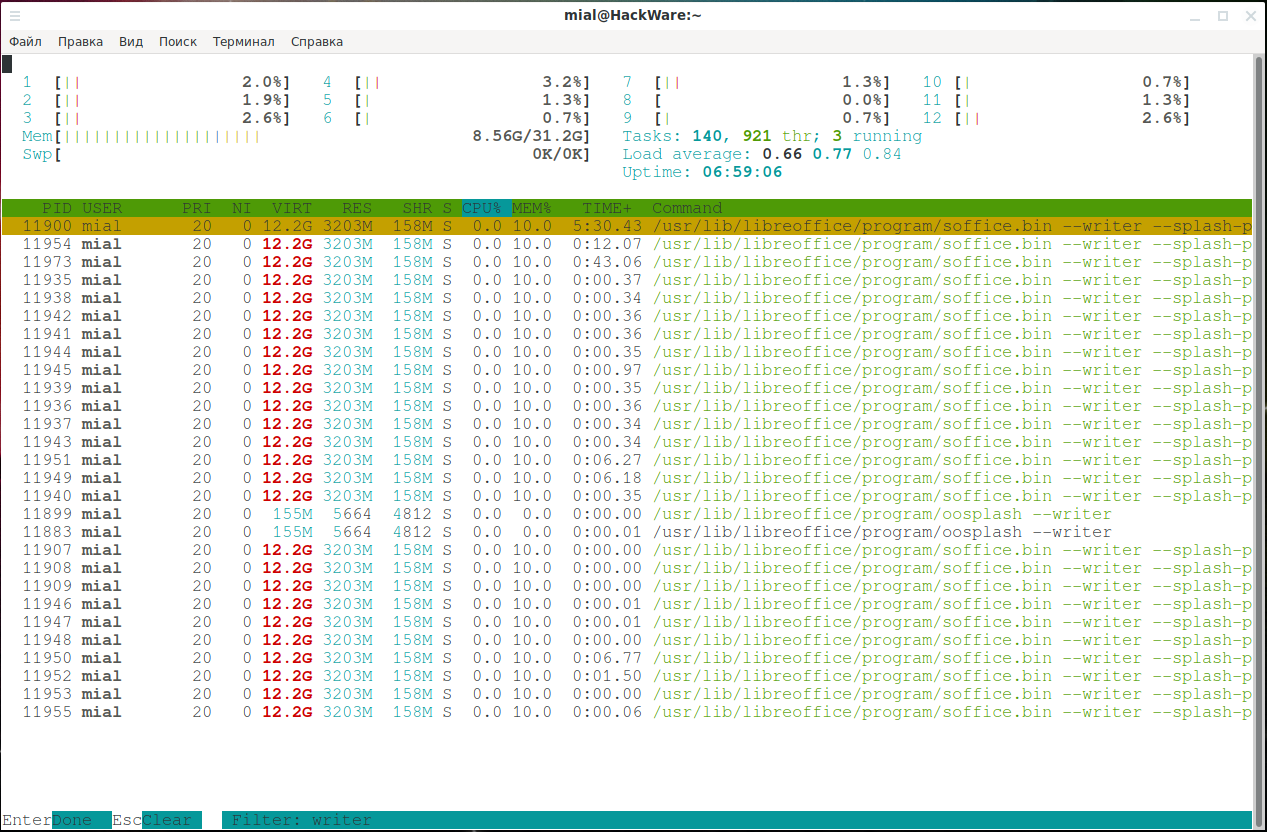
Press F4 and then Esc again to clear the filter.
How to change the priority of a process in htop
To increase the priority of the process (subtract from the nice value) press the F7 or “]” key. Remember that only the superuser can do this operation (you must be root or run htop with sudo).
To decrease the priority of the process (add to the nice value) press the F8 or “[” key.
How to select one or more processes in htop
Use “Space” to select processes. After that, the entered commands, such as kill or changing the priority, can be applied to the group of selected processes instead of the currently highlighted one.
To deselect all processes, press “U” (Shift+u).
How to close a process in htop
To close a process, select one or more processes and press F9 or “k”. A termination signal will be sent to the selected process. If no process is marked, then the one on which the cursor is currently located will be closed.
How to show the files that a process is using
If you want to see the files opened by the process, then highlight the process you are interested in and press the “l” (small Latin L) button.
The lsof utility must be installed on the system for this feature to work.
See also: How to use lsof to view open files (on Linux, everything is files)
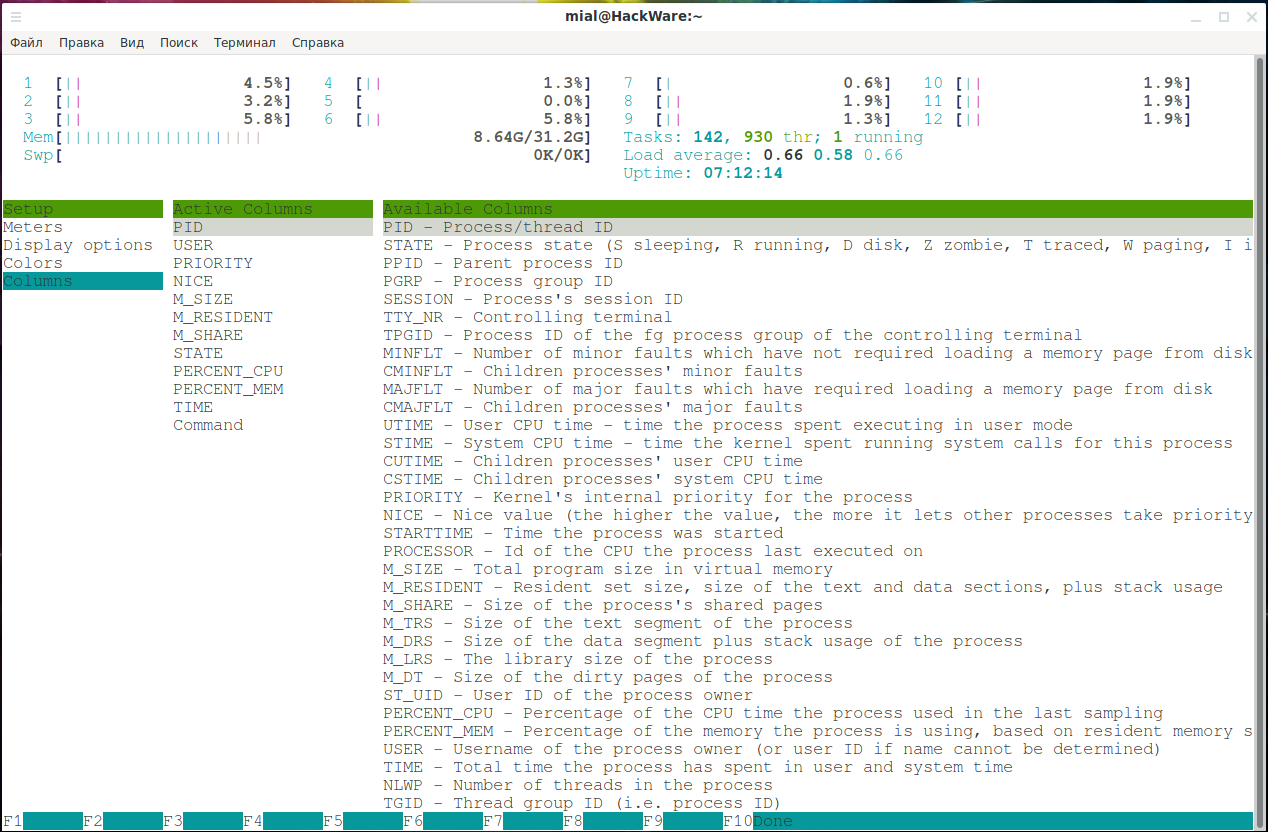
How to change the appearance of htop
To change the appearance of the panel with information about the system, displayed columns, etc., press the F2 or “S” (Shift+s) button.
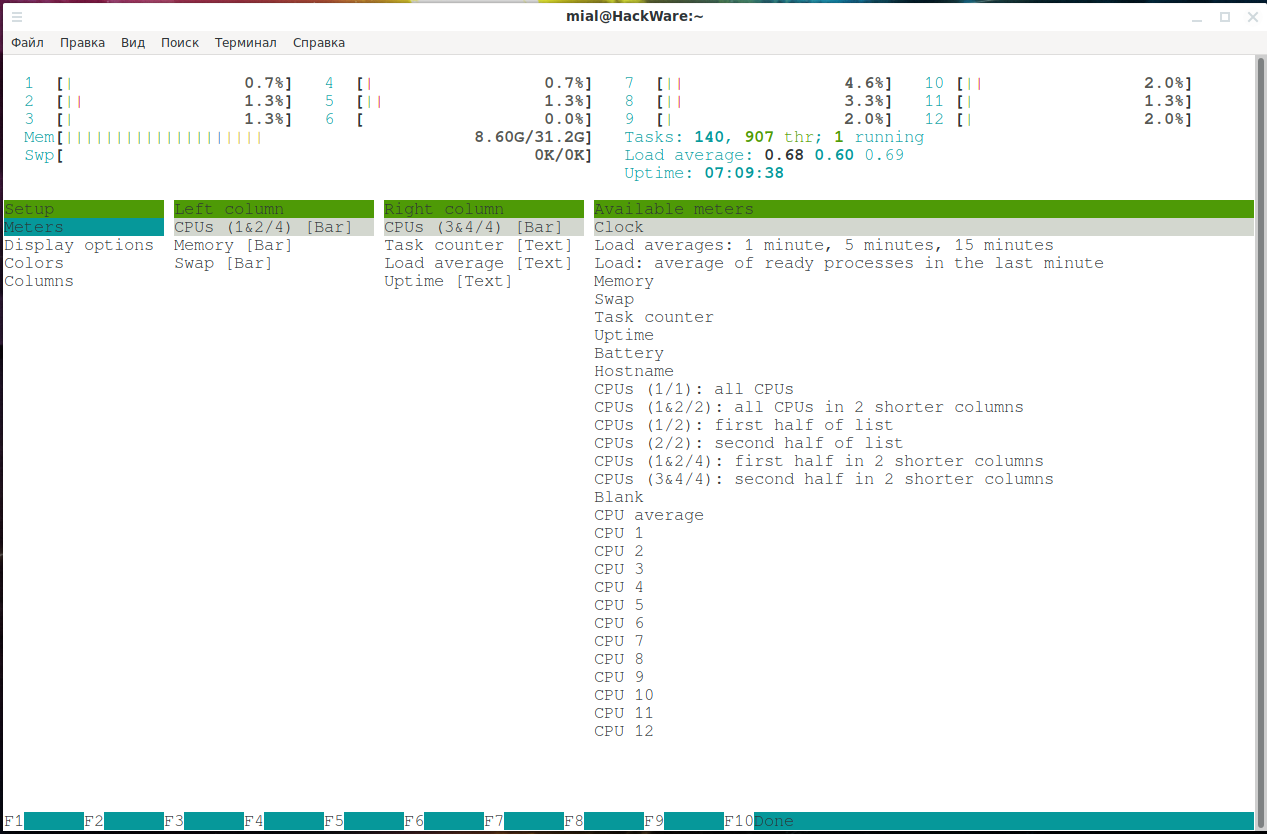
There you will see the following tabs:
- Meters (information displayed at the top of the window about the CPU, memory, etc.)
- Display options
- Colors
- Columns (change the order of columns, add and remove columns)
How to specify the field to sort when starting htop
Using the -s option, you can specify the column by which the processes will be sorted.
For example, to sort processes by the PERCENT_MEM column (percentage of memory used):
sudo htop -s PERCENT_MEM
To see all available columns for sorting, run the command:
htop --sort-key help
How to show only processes of a specific user
Use the -u option to a command like:
sudo htop -u USER
For example, to display processes of only user named mial:
sudo htop -u mial
How to show only the process with a certain number
To monitor only some processes, use the -p PID,PID… option. You can separate one or more process IDs, separated by commas. Only these processes will be shown in the htop window.
System call tracing
You can trace what system calls the process made. To do this, select the process you are interested in and press the “s” button.
For this function to work, you must have the strace utility installed.
How to close htop
Press F10 or “q” or Ctrl+c to exit the program.
If htop isn't enough for you, see “How to use the top command to monitor Linux processes”.
Related articles:
- How to use the top command to monitor Linux processes (100%)
- How to use ps command to monitor Linux processes (79.3%)
- What are the differences and how to use the kill, pkill and killall commands (63.1%)
- Why doesn't the kill command kill the process? (61.7%)
- What happens if Linux runs out of RAM. Do I need a Swap file (55.5%)
- How to Install the Latest Linux Kernels on Debian and Debian Based Distributions (RANDOM - 50%)